Wednesday, March 4, 2015

Clustering in Linux

What is a Cluster :

A computer cluster is a group of linked computers, working together closely so that in many respects they form a single computer. The components of a cluster are commonly, but not always, connected to each other through fast local area networks. Clusters are usually deployed to improve performance and/or availability over that of a single computer, while typically being much more cost-effective than single computers of comparable speed or availability. 


Common terminology in Cluster Environments:

Node : 
It’s one of the system/computer which participates with other systems to form a Cluster.


Heartbeat : 
This a pulse kind of single which is send from all the nodes at regular intervals using a UDP packet so that each system will come to know the status of availability of other node. It’s a kind of door knocking activity like pinging a system, So that each node which are participating in Cluster will come to know the status of other nodes availability in the Cluster.


Floating IP or Virtual IP : 
This is the IP assigned to the Cluster through which user can access the services. So when ever clients request a service they will be arrived to this IP, and client will not know what are the back-end/actual ip addresses of the nodes. This virtual IP is used to nullify the effect of nodes going down.

Master node : 
This is the node most of the time where services are run in a High availability Cluster.


Slave node : 
This is the node which is used in High availability Cluster when master node is down. It will take over the role of servicing the users, when it will not receive heartbeat pulse from master. And automatically gives back the control when the master server is up and running. This slave comes to know about the status of master through heartbeat pulse/signals.


Types of Clusters:

Cluster types can be divided in to two main types :

1. High availability :
These types of Clusters are configured where there should be no downtime. If one node in the cluster goes down second node will take care of serving users without interrupted service with availability of five nines i.e. 99.999%.

2. Load balancing :
These types of Clusters are configured where there are high loads from users. Advantages of load balancing are that users will not get any delays in their request because load on a single system is shared by two or more nodes in the Cluster.


Advantages of Cluster :

1.Reduced Cost : 
2. Processing Power
3. Scalability
4. Availability

Nagios - Use an external smtp server to send notifications

Introduction

One of the most important feature of the monitoring platform is the notification system; by default  they use the local mail daemon (postfix,mail,exim) installed on the server to send the notifications.
Using local mail daemon has many issues :
  • You need to install and configure your smtp server.
  • Maybe your mail server go down so you can’t receive the alert.
  • Maybe this kind of emails from a not verified source like nagios can be filtered by the same company antispam system.
In order to avoid all issues, In this article I am going to explain how to send alert from monitoring tool Nagios Core using an external smtp server with authentication like Gmail and Yahoo.
This task was not so easy since communicating with Gmail through a linux server was requiring permissions and certifications but with sendEmail you can do it easily.

Installation and Configuration Of SendEmail

SendEmail is an email program for sending SMTP mail from a command line. SendEmail is a lightweight program written in Perl and is unique in that it requires NO MODULES. It has an intuitive and flexible set of command-line options, making it very easy to learn and use.

SendEmail is licensed under the GNU GPL and supported many platforms like: Linux, BSD, OS X, Windows 98, Windows NT, Windows 2000, & Windows XP

System Requirements

SendEmail requires certain technical requirements to be met for the store to operate properly. You should check to see that these server requirements are provided and installed on your monitoring servers.

The following commands should be run as root user privileges.
To install those requirements use this command:

On Ubuntu:
apt-get install libio-socket-ssl-perl libnet-ssleay-perl perl

On CentOS:
yum install libio-socket-ssl-perl libnet-ssleay-perl perl

In order to send email via gmail you also need additional libraries “Net::SSLeay” and “IO::Socket::SSL” which are needed for authentication.
To install those libraries use this command:

On Ubuntu:
apt-get install 'perl(Net::SSLeay)' 'perl(IO::Socket::SSL)'

On CentOS:
yum install 'perl(Net::SSLeay)' 'perl(IO::Socket::SSL)'

Download and Installation of sendEmail


In order to start the installation , download the sendEmail tar archive:
wget http://caspian.dotconf.net/menu/Software/SendEmail/sendEmail-v1.56.tar.gz

Then extract it:
tar -zxvf sendEmail-v1.56.tar.gz

Then copy the sendEmail script to /usr/local/bin. Make use that you have root permission.
cd sendEmail-v1.56
sudo cp -a sendEmail /usr/local/bin

The script needs to be executable, so go make it.
sudo chmod +x /usr/local/bin/sendEmail

Then, go ahead and run:
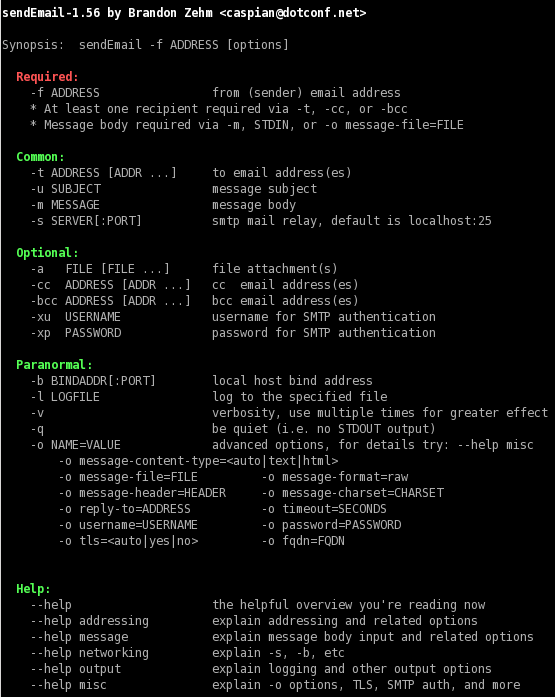
sendEmail

If everything work fine, you will see a usage summary of sendEmail.

send

In order to troubleshoot any eventual problem, you can  create a log file fro senEmail.
touch /var/log/sendEmail
chmod 666 /var/log/sendEmail

In order to test sending an email via Gmail, the command should look like this:
sendEmail -v -f $username -s $host -xu $username -xp $password -t $recipient -o tls=yes -u $subject -m $content

Configure Nagios Core to Send notification Using Gmail

In order to configure Nagios core to send alert using sendEmail and external smtp server like Gmail, you need to flow those steps:

Start by editing the resource.cfg file located in /usr/local/nagios/etc/resource.cfg :

vi /usr/local/nagios/etc/resource.cfg

Add the following lines with your particular smtp configuration:
$USER5$=email@address.tld
$USER7$=smtp.server.tld:25
#If you don’t use smtp authentication skip this variables and use the version B) of commands.cfg
$USER9$=username
$USER10$=password
On the case of Gmail smtp you can see this example:
$USER5$=email@gmail.com
$USER7$=smtp.gmail.com:587
$USER9$=email
$USER10$=password
Save the file resource.cfg and exit.
After this go under /usr/local/nagios/etc/objects/ and edit the file commands.cfg but that perform a backup of the config file:

cd /usr/local/nagios/etc/objects/
cp commands.cfg commands.cfg.old
Edit the commands.cfg file and you will find two commands ‘notify-host-by-email’ and ‘notify-service-by-email’

A – SMTP AUTHENTICATION COMMANDS
Now, if you use SMTP authentication replace the two commands with the following:
# 'notify-host-by-email' command definition define command{command_name notify-host-by-email command_line /usr/bin/printf "%b" "***** Nagios *****\n\nNotification Type: $NOTIFICATIONTYPE$\nHost: $HOSTNAME$\nState: $HOSTSTATE$\nAddress: $HOSTADDRESS$\nInfo: $HOSTOUTPUT$\n\nDate/Time: $LONGDATETIME$\n" | /usr/local/bin/sendEmail -s $USER7$ -xu $USER9$ -xp $USER10$ -t $CONTACTEMAIL$ -f $USER5$ -l /var/log/sendEmail -u "** $NOTIFICATIONTYPE$ Host Alert: $HOSTNAME$ is $HOSTSTATE$ **" -m "***** Nagios *****\n\nNotification Type: $NOTIFICATIONTYPE$\nHost: $HOSTNAME$\nState: $HOSTSTATE$\nAddress: $HOSTADDRESS$\nInfo: $HOSTOUTPUT$\n\nDate/Time: $LONGDATETIME$\n" }

# 'notify-service-by-email' command definition define command{command_name notify-service-by-email command_line /usr/bin/printf "%b" "***** Nagios *****\n\nNotification Type: $NOTIFICATIONTYPE$\n\nService: $SERVICEDESC$\nHost: $HOSTALIAS$\nAddress: $HOSTADDRESS$\nState: $SERVICESTATE$\n\nDate/Time: $LONGDATETIME$\n\nAdditional Info:\n\n$SERVICEOUTPUT$" | /usr/local/bin/sendEmail -s $USER7$ -xu $USER9$ -xp $USER10$ -t $CONTACTEMAIL$ -f $USER5$ -l /var/log/sendEmail -u "** $NOTIFICATIONTYPE$ Service Alert: $HOSTALIAS$/$SERVICEDESC$ is $SERVICESTATE$ **" -m "***** Nagios *****\n\nNotification Type: $NOTIFICATIONTYPE$\n\nService: $SERVICEDESC$\nHost: $HOSTALIAS$\nAddress: $HOSTADDRESS$\nState: $SERVICESTATE$\n\nDate/Time: $LONGDATETIME$\n\nAdditional Info:\n\n$SERVICEOUTPUT$" }

B- NO SMTP-AUTHENTICATION 
This is pretty much the same but without passing the authentication triggers to sendemail:

# 'notify-host-by-email' command definition define command{command_name notify-host-by-email command_line /usr/bin/printf "%b" "***** Nagios *****\n\nNotification Type: $NOTIFICATIONTYPE$\nHost: $HOSTNAME$\nState: $HOSTSTATE$\nAddress: $HOSTADDRESS$\nInfo: $HOSTOUTPUT$\n\nDate/Time: $LONGDATETIME$\n" | /usr/local/bin/sendEmail -s $USER7$ -t $CONTACTEMAIL$ -f $USER5$ -l /var/log/sendEmail -u "** $NOTIFICATIONTYPE$ Host Alert: $HOSTNAME$ is $HOSTSTATE$ **" -m "***** Nagios *****\n\nNotification Type: $NOTIFICATIONTYPE$\nHost: $HOSTNAME$\nState: $HOSTSTATE$\nAddress: $HOSTADDRESS$\nInfo: $HOSTOUTPUT$\n\nDate/Time: $LONGDATETIME$\n" }

# 'notify-service-by-email' command definition define command{command_name notify-service-by-email command_line /usr/bin/printf "%b" "***** Nagios *****\n\nNotification Type: $NOTIFICATIONTYPE$\n\nService: $SERVICEDESC$\nHost: $HOSTALIAS$\nAddress: $HOSTADDRESS$\nState: $SERVICESTATE$\n\nDate/Time: $LONGDATETIME$\n\nAdditional Info:\n\n$SERVICEOUTPUT$" | /usr/local/bin/sendEmail -s $USER7$ -t $CONTACTEMAIL$ -f $USER5$ -l /var/log/sendEmail -u "** $NOTIFICATIONTYPE$ Service Alert: $HOSTALIAS$/$SERVICEDESC$ is $SERVICESTATE$ **" -m "***** Nagios *****\n\nNotification Type: $NOTIFICATIONTYPE$\n\nService: $SERVICEDESC$\nHost: $HOSTALIAS$\nAddress: $HOSTADDRESS$\nState: $SERVICESTATE$\n\nDate/Time: $LONGDATETIME$\n\nAdditional Info:\n\n$SERVICEOUTPUT$" }
Now the configuration is finished. Before applying the new configuration, run the following command to check for any error or mistake:

/usr/local/nagios/bin/nagios -v /usr/local/nagios/etc/nagios.cfg

If there are no errors, restart the nagios service:
service nagios restart

To troubleshoot the sendemail command run the following to check in the log file:
tail -f /var/log/sendEmail

Receiving SNMP Traps in Nagios


 SNMP traps are alerts and notifications generated by SNMP-enabled devices. The traps con-tain information about the status or an event on an SNMP-enabled device. For example, an authentication event or the change in status of an interface on a router may generate an SNMP trap that is sent to a management station of some sort, such as HP OpenView, CiscoWorks, Nagios.

Pre-requisites:

1. Net-SNMP with snmptrapd configured.
2. SNMPTT, SNMP trap translator.
3. Nagios.
5. Mib definition files for the equipment or software you need to monitor.

Installing Net-SNMP packages:

The Net-SNMP package is available as a series of installable packages on many distributions. Indeed, it may already be installed on your system or you may be able to install it via your distribution’s package management system, such as yum, apt, or the like. On Red Hat, SuSE, Debian, and Mandrake
distributions, the required packages are called net-snmp, net-snmp-libs, and net-snmp-utils.

Installing Net-SNMP packages on Centos 5.5

# yum install net-snmp net-snmp-libs net-snmp-utils net-snmp-perl perl-Net-SNMP net-snmp-devel

Configuring and Running the snmptrapd Daemon
When incoming traps are received from the snmptrapd daemon, they are passed to the SNMPTT tool. The SNMPTT tool will then try to match the incoming trap against the collection of trap definitions that it has translated. If the trap matches, SNMPTT will see if the translated trap definition contains logic to output it to Nagios and execute that logic. The trap is then out-put to Nagios as a passive check result.

On Centos 5.5

# vi /etc/sysconfig/snmptrapd.options
#OPTIONS="-On -Lsd -c /etc/snmp/snmptrapd.conf -p /var/run/snmptrapd.pid"
OPTIONS="-On -Lsd -p /var/run/snmptrapd.pid"

Make sure to remove the -c /etc/snmp/snmptrapd.conf part, otherwise you will receive TRAP twice, as snmptrapd' is compiled with the default configuration file path being already set to '/etc/snmp/snmptrapd.conf'.

As quoted from SNMP Trap Translator documentation: "The -On is recommended. This will make snmptrapd pass OIDs in numeric form and prevent SNMPTT from having to translate the symbolic name to numerical form."

# vi /etc/snmp/snmptrapd.conf
traphandle default /usr/sbin/snmptthandler
disableAuthorization yes
#donotlogtraps  yes

The traphandle directive tells the snmptrapd daemon how to handle incoming traps and where to send them. Adding the default option tells the daemon that this is the default way to handle all incoming traps. All traps will be sent to the snmptthandler script located in the /usr/sbin directory, the "disableAuthorization yes" tells to accept SNMP traps from all you can configure it to do authentication for detail refer to snmptrapd.conf manual.

Installing SNMPTT (SNMP Trap Translator)
You can get the SNMPTT tool from Sourceforge at http://snmptt.sourceforge.net/. This line shows how to download and unpack the SNMPTT tool:
Download snmptt_1.3.tgz which the latest version/stable release.

tar -zxvf snmptt_1.3.tgz

The SNMPTT package has no installation script, so a number of manual installations steps need to take place. First, copy the SNMPTT binaries to a suitable directory and mark them as executable. I recommend using the /usr/sbin directory

# cp snmptt snmptthandler /usr/sbin/
# chmod +x /usr/sbin/snmptt /usr/sbin/snmptthandler

I specified the snmptthandler binary as the value of the traphandle option in the snmptrapd.conf configuration file in the previous section. When a trap is received, this binary is executed by default and the trap sent to the snmptt daemon

Next, copy the SNMPTT configuration file, snmptt.ini, to the /etc/snmp directory and snmpttconvertmib utility

# cp snmptt.ini /etc/snmp/
# cp snmpttconvertmib /usr/sbin/

Also needed are a user and group to run the SNMPTT daemon as.

# groupadd snmptt
# adduser -g snmptt snmptt

# chown snmptt:snmptt /etc/snmp/snmptt.ini

The SNMPTT tool also needs a spool directory to hold the incoming traps. I usually use the default directory of /var/spool/snmptt. It needs to be owned by the user and group that will run SNMPTT. Create and change the ownership of the directory like so

# mkdir /var/spool/snmptt
# chown snmptt:snmptt /var/spool/snmptt

Finally, in order to start the SNMPTT tool, you can either execute it from the command line or use the init script provided with the package. On the following line

SNMPTT started in daemon mode:
# /usr/sbin/snmptt -daemon

Or copy the init script provided with the package, you can then add it to your startup process.

# cp snmptt-init.d /etc/init.d/snmptt

To start/stop/reload you can do with ..

/etc/init.d/snmptt start/stop/reload

Configuring SNMPTT
The first is configuring the /etc/snmp/snmptt.ini file. The file contains quite a large number of directives, but I’ll only look at those relevant to the process of translating and transmitting the received traps to Nagios

mode = daemon
daemon_fork = 1
daemon_uid = snmptt
spool_directory = /var/spool/snmptt/
sleep = 5
dns_enable = 1
strip_domain = 1
log_enable = 1
syslog_enable = 0
exec_enable = 1
snmptt_conf_files = <
/etc/snmp/snmptt.conf
END


The sample snmptt.ini file contained in the SNMPTT package has detailed explanations of all the directives and options that you can specify. I recommend reading this file for further information and explanations about SNMPTT’s configuration options

Tip:  If you enable DNS resolution, I recommend you add all the hostnames that need to be resolved to the local /etc/hosts file on your host server. This prevents your DNS server from being a bottleneck or preventing SNMPTT from functioning if your DNS server is unavailable.

Compiling MIBs
You must gather all MIBs for monitored software, so you can feed SNMPTT with them. Compiling consists in extracting each OID of type "trap" and its associated comments, and generate a configuration file in SNMPTT format from these informations.

Run the following command on each of your MIB files:

snmpttconvertmib --in= --out=/etc/snmp/snmptt.conf. \
--exec='/usr/local/nagios/libexec/eventhandlers/submit_check_result $r TRAP 1'

The resulting SNMPTT configuration file will contain blocks (one per selected OID)


Catchall Trap Definition
SNMPTT also has a regular expression–matching capability that allows you to use an EVENT line that matches multiple incoming traps, a catchall trap definition. This means you don’t need to define individual translated trap definitions for each possible incoming trap.

Catchall Trap Definition
EVENT CatchAll .1.* "SNMP Traps" Critical
FORMAT $D
EXEC /usr/local/nagios/libexec/eventhandlers/submit_check_result "$r" 
"snmp_traps" 2 "$O: $1 $2 $3 $4 $5"

I could also be more selective and select OIDs from a particular vendor or class of trap either using a wildcard or regular expression pattern matching. I’ve added a category called SNMP Traps and severity of Warning.

For example here is example to catchall traps from a specific vendor OID.

EVENT CatchAll .1.3.6.1.4.1.20916.* "Status Events" Normal
FORMAT A room-alert-4e-snmp-trap indicates that an alarm $*
EXEC /usr/lib/nagios/plugins/eventhandlers/submit_check_result $r "snmp_traps" 1 "A room-alert-4e-snmp-trap indicates that an alarm $*"
SDESC
A room-alert-4e-snmp-trap indicates that an alarm
condition has occurred on the sensor indicated
by the alarmmessage variable.
Variables:
  1: alarmmessage
EDESC

When done, add to SNMPTT configuration file /etc/snmp/snmptt.ini the path to compiled configuration files:

[...]
snmptt_conf_files = <<END
/etc/snmp/snmptt.conf.
END


Configuring Nagios
You will use passive checks to receive SNMP traps but they also will be volatiles. If ever two traps are received from the same host, the second one coming in before the first one was reset to OK, we want to be notified twice, although there is no state change. That's why we use a volatile service.

You might define (for example) a service template for SNMP traps, inheriting from a generic service template:

define service{
        name                            generic-service    
        active_checks_enabled           1                     
        passive_checks_enabled          1                       ; Passive service checks are enabled/accepted
        parallelize_check               1                     
        obsess_over_service             1                      
        check_freshness                 0                      
        notifications_enabled           1                       ; Service notifications are enabled
        event_handler_enabled           1                       ; Service event handler is enabled
        flap_detection_enabled          1                       ; Flap detection is enabled
        failure_prediction_enabled      1                       ; Failure prediction is enabled
        process_perf_data               1                       ; Process performance data
        retain_status_information       1                       ; Retain status information across program restarts
        retain_nonstatus_information    1                       ; Retain non-status information across program restarts
        is_volatile                     0                       ; The service is not volatile
        check_period                    24x7                    ; The service can be checked at any time of the day
        max_check_attempts              3                       ; Re-check the service up to 3 times in order to determine its final (hard) state
        normal_check_interval           10                      ; Check the service every 10 minutes under normal conditions
        retry_check_interval            2                       ; Re-check the service every two minutes until a hard state can be determined
        contact_groups                  admins                  ; Notifications get sent out to everyone in the 'admins' group
        notification_options            w,u,c,r                 ; Send notifications about warning, unknown, critical, and recovery events
        notification_interval           60                      ; Re-notify about service problems every hour
        notification_period             24x7                    ; Notifications can be sent out at any time
         register                        0                      ; DONT REGISTER THIS DEFINITION - ITS NOT A REAL SERVICE, JUST A TEMPLATE!
        }

define service{
name                    trap-service
use                     generic-service
register                0
service_description     snmp_traps
is_volatile             1
check_command           check-host-alive    ;Used to reset the status to OK when 'Schedule an immediate check of this service' is selected.
flap_detection_enabled  0                               ; Flap detection is disabled
process_perf_data       0                               ; Do not Process performance data
max_check_attempts      1                    ; Leave as 1
normal_check_interval   1                    ; Leave as 1
retry_check_interval    1                    ; Leave as 1
passive_checks_enabled  1                    ; Enables passive checks
check_period            24x7
notification_interval   31536000                ; Notification interval.  Set to a very high number to prevent you from getting                                 pages of previously received traps (1 year - restart Nagios at least once a year! -                                     do not set to 0!).
active_checks_enabled   0                    ; Prevent active checks from occuring as we are only using passive checks.
notification_options    w,u,c                    ; Notify on warning, unknown and critical.
contact_groups          sysadmins
}

define service{
 host_name       AVT-Room-Alert ; hostname is define /etc/hosts file
 use             trap-service
 contact_groups sysadmins
}

TIP: You could also use a wildcard to create this service for all hosts or use the hostgroup_name directive to create the service for all members of a host group or groups.

I’ve defined the service as volatile and set the maximum check attempts to 1. This will cause Nagios to immediately set a HARD service state and trigger any configured notifications or event handlers. I’ve also configured it for passive checks only and disabled active checks.

Putting It All Together

The SNMPTT tool is called via the trap handler defined in the snmptrapd.conf configuration file I defined in the “Configuring and Running the snmptrapd Daemon” section. This trap handler calls the /usr/sbin/snmptthandler script. The script reads the trap and then writes it to the spool directory defined in the spool_directory directive from the snmptt.ini configuration file. The script then exits.

From here the SNMPTT daemon takes over. It reads the trap from the spool file and searches for a match in its trap definitions. If it finds a match, it executes the EXEC statement in the matching trap definition. This EXEC statement sends the passive check result to the Nagios server using the submit_check_result script. The daemon then sleeps for the period specified in the sleep directive in the snmptt.ini file and checks the spool directory for additional traps; if it finds matches, it processes them and sends the check results to Nagios.

The Nagios server has to have host objects defined for every host that generates SNMP traps. Additionally, you need to define service objects for those hosts to receive the service check results. You should configure them to receive passive check results and as volatile services.

source : http://askaralikhan.blogspot.com/2010/12/receiving-snmp-traps-in-nagios.html

How to Install Nagios 4.0.8 (Monitoring Server) on CentOS, Red Hat & Fedora

Nagios is the most popular, open source, powerful monitoring system. It enables organizations to identify and resolve IT infrastructure problems before they affect critical business processes. Nagios has capability of monitoring application, services, entire IT infrastructure.

nagios-core

This is Part-1 of complete article How to Setup Nagios Monitoring Server with NagiosQL on CentOS/RHEL 6/5, In this part you will find the steps to setup Nagios Monitoring Server on CentOS, Redhat and Fedora systems.

Step 1: Install Required Packages and Dependencies

We assume that you have fresh installed CentOS, Red hat or Fedora systems, So our first requirement is to install Apache and PHP first.

Install Packages:

# yum install httpd php php-cli gcc glibc glibc-common gd gd-devel net-snmp

Start Services:

# service httpd start

Step 2: Setup User Accounts

Now create a new nagios user account and setup a password to this account
# useradd nagios
# passwd nagios

Now create a groud for nagios setup “nagcmd” and add nagios user to this group. Also add nagios user in apache group.
# groupadd nagcmd
# usermod -a -G nagcmd nagios
# usermod -a -G nagcmd apache

Step 3: Install Nagios Core Service

After installing required dependencies and adding user accounts. Lets start with Nagios core installation. Download latest nagios core service from official site.


# cd /opt/
# wget http://prdownloads.sourceforge.net/sourceforge/nagios/nagios-4.0.8.tar.gz
# tar xzf nagios-4.0.8.tar.gz
# cd nagios-4.0.8
# ./configure --with-command-group=nagcmd
# make all
# make install
# make install-init
# make install-config
# make install-commandmode

Now use below command to setup apache configuration for Nagios installation.
# make install-webconf

Step 4: Configure Apache Authentication

We need to setup apache authentication for user nagiosadmin. Do not change this username. else you would required more changes in configuration.
# htpasswd -c /usr/local/nagios/etc/htpasswd.users nagiosadmin

Now restart Apache service to make the new settings take effect.
# service httpd restart

Step 5: Install Nagios Plugins

After installing and configuring Nagios core service, Download latest nagios-plugins source and install using following commands.

# cd /opt
# wget http://nagios-plugins.org/download/nagios-plugins-2.0.3.tar.gz
# tar xzf nagios-plugins-2.0.3.tar.gz
# cd nagios-plugins-2.0.3

Now compile and install nagios plugins
# ./configure --with-nagios-user=nagios --with-nagios-group=nagios
# make
# make install

Step 6: Verify and Start Nagios

Use the following commands to verify nagios install and start nagios core service.
# /usr/local/nagios/bin/nagios -v /usr/local/nagios/etc/nagios.cfg
# service nagios start

Also configure nagios service to start on system start
# chkconfig --add nagios
# chkconfig nagios on

Step 7: Access Nagios in Web Browser

Nagios creates its own apache configuration file /etc/httpd/conf.d/nagios.conf. There are no need to make any changes to it. Simply open below url in browser.


[change domain name with your domain or ip]
http://svr1.tecadmin.net/nagios/

Prompting for Apache Authentication Password –
nagios-web-interface-login

Nagios After login screen :-

nagios-web-interface

Now you have successfully installed and configured Nagios core service in your system.

How to Monitor Remote Linux Host using Nagios and NRPE

NRPE is known as Nagios Remote Plugin Executor. The NRPE add-on is designed to execute plugins on remote Nix systems. In this setup NRPE daemon is installed on remote system to which services need to monitor through nagios server.

NRPE runs as daemon on remote systems and wait for nagios requests. When nagios server need to check status of any resources or applications to that remote host, sends and commands signal, which command definition is stored on NRPE service. NRPE takes nagios server request and execute command on local system and sends the result back to nagios.

nagios-nrpe-monitoring

This article will help you to install NRPE service on your Linux system and add host in nagios for monitoring.

Step 1: Setup NRPE Service on Linux Host

1.1- Install NRPE

Firstly we would require to install nrpe service on remote Linux system, which we need to monitory through nagios server.

On CentOS/RHEL/Fedora
# yum install nrpe nagios-plugins\*

On Debian/Ubuntu/LinuxMint
# sudo apt-get install nagios-nrpe-server nagios-plugins

1.2- Configure NRPE

After successfully installing NRPE service, Edit nrpe configuration file (/etc/nagios/nrpe.cfg) in your favorite editor and add your nagios service ip in allowed hosts. For example your nagios server ip is
192.168.1.100.

# vim /etc/nagios/nrpe.cfg
allowed_hosts=127.0.0.1, 192.168.1.100

After making above changes in nrpe configuration file, Lets restart NRPE service as per your system
On CentOS/RHEL/Fedora 
# service nrpe restart

On Debian/Ubuntu/LinuxMint
$ sudo /etc/init.d/nagios-nrpe-server restart

1.3- Verify Connectivity from Nagios

Now make sure your nagios is able to connect nrpe client on remote Linux system. Login to your nagios server from command line and execute following command. For example your client system ip is 192.168.1.11

# /usr/local/nagios/libexec/check_nrpe -H 192.168.1.11

NRPE v2.14

Step 2: Add Linux Host in Nagios

We recommend to use NagiosQL3 web interface for managing configuration of nagios server. Below steps is for CLI lovers. To add host in your nagios server from command line.
First create a configuration file /usr/local/nagios/etc/servers/MyLinuxHost001.cfg using below values. for example you Linux hosts ip is 192.168.1.11. We also need to define a service with host. So add a ping check service, which will continuously check that host is up or not.

# vim /usr/local/nagios/etc/servers/MyLinuxHost001.cfg
#########################################################
# Linux Host 001 configuration file
#########################################################

define host {
        use                          linux-server
        host_name                    Linux_Host_001
        alias                        Linux Host 001
        address                      192.168.1.11
        register                     1
}
define service{
      host_name                       Linux_Host_001
      service_description             PING
      check_command                   check_ping!100.0,20%!500.0,60%
      max_check_attempts              2
      check_interval                  2
      retry_interval                  2
      check_period                    24x7
      check_freshness                 1
      contact_groups                  admins
      notification_interval           2
      notification_period             24x7
      notifications_enabled           1
      register                        1
}


#########################################################
# END OF FILE
#########################################################

Now verify configuration files using following command. If there are no errors found in configuration, restart nagios service.
# nagios -v /usr/local/nagios/etc/nagios.cfg
# service nagios restart

Step 3: Check Host in Nagios Web Interface

Open your nagios web interface and check for new Linux hosts added in nagios core service. In my case it looks like below.

Nagios-Linux-host

How to Generate md5 checksum for all Files in a Directory

Generate md5 checksum:

find . -exec md5sum “{}” \; > /tmp/wwwmd5.list

Above command will generate md5 checksum for all files in current directory and its sub-directory and store it in /tmp/mymd5.list file.

Generate MD5:

If we want to generate md5sum of all files in our home directory and its sub-directory. Use the following command.
# find ~/ -exec md5sum "{}" \; > ~/usermd5.list

If we want to generate md5sum for specific files for example all php and JavaScript files under public_html directory use following command.
# find ~/public_html/ -name "*.php" -exec md5sum "{}" \; > ~/usermd5.list
# find ~/public_html/ -name "*.js" -exec md5sum "{}" \; >> ~/usermd5.list

Verify MD5:

Now verify all files using generated md5sum file using following command. This command will show output as OK or FAILD.

# md5sum -c ~/usermd5.list

How To Change Timezone on CentOS and RedHat 7/6/5

Sometimes we forgot to set timezone properly for newly installed system or sometimes we need to change timezone of systems for various testing etc. Under CentOS/RHEL systems all timezone settings file are located under /usr/share/zoneinfo/ directory and /etc/localtime is the file use is used by operating system to set current timezone for system. So the best way to change time zone of server is to link /etc/localtime file to correct configuration file under /usr/share/zoneinfo/ files.

First check current timezone used by your system using date command.
# date

Thu Jan 2 05:12:25 EST 2015
As per above example our system timezone is set to EST.

Change TimeZone in CentOS/RHEL 7

In CentOS/RHEL 7 we use timedatectl command to change current timezone of system. First use following command to list all timezones

# timedatectl list-timezones

Now use following command to change timezone to America/Los_Angeles.

# timedatectl set-timezone America/Los_Angeles

Change TimeZone in CentOS/RHEL 6/5

To change timezone on CentOS/RHEL 6/5 we can simply link /etc/localtime file with correct timezone configuration file. For example we are setting America/Los_Angeles as our local system timezone.


# mv /etc/localtime /root/localtime.old
# ln -s /usr/share/zoneinfo/America/Los_Angeles /etc/localtime

Source : http://tecadmin.net